> ## Documentation Index
> Fetch the complete documentation index at: https://docs.goldsky.com/llms.txt
> Use this file to discover all available pages before exploring further.
# Monitoring
> Real-time metrics and logs for Edge RPC
Edge RPC includes built-in observability with advanced Grafana dashboards, giving you complete visibility into your RPC usage, performance, and health.
## Metrics
The metrics dashboard provides real-time insights across multiple dimensions:
### Overall
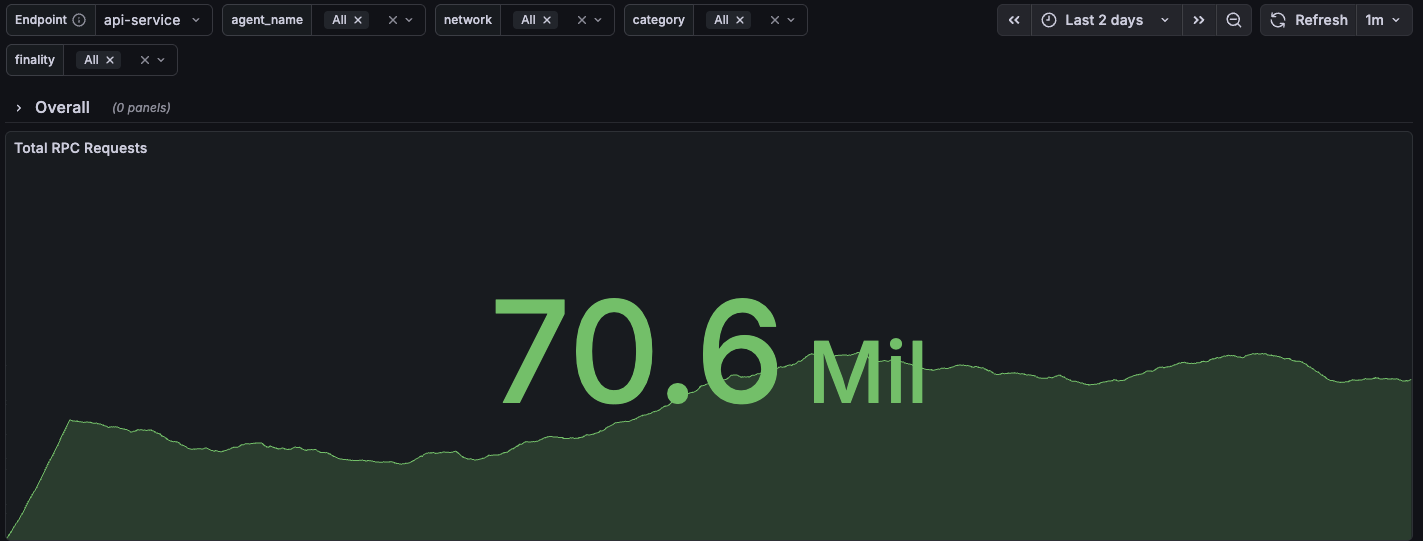
The top-level view showing **Total RPC Requests** across all networks, with a time-series sparkline showing request volume trends.
 ### Usage
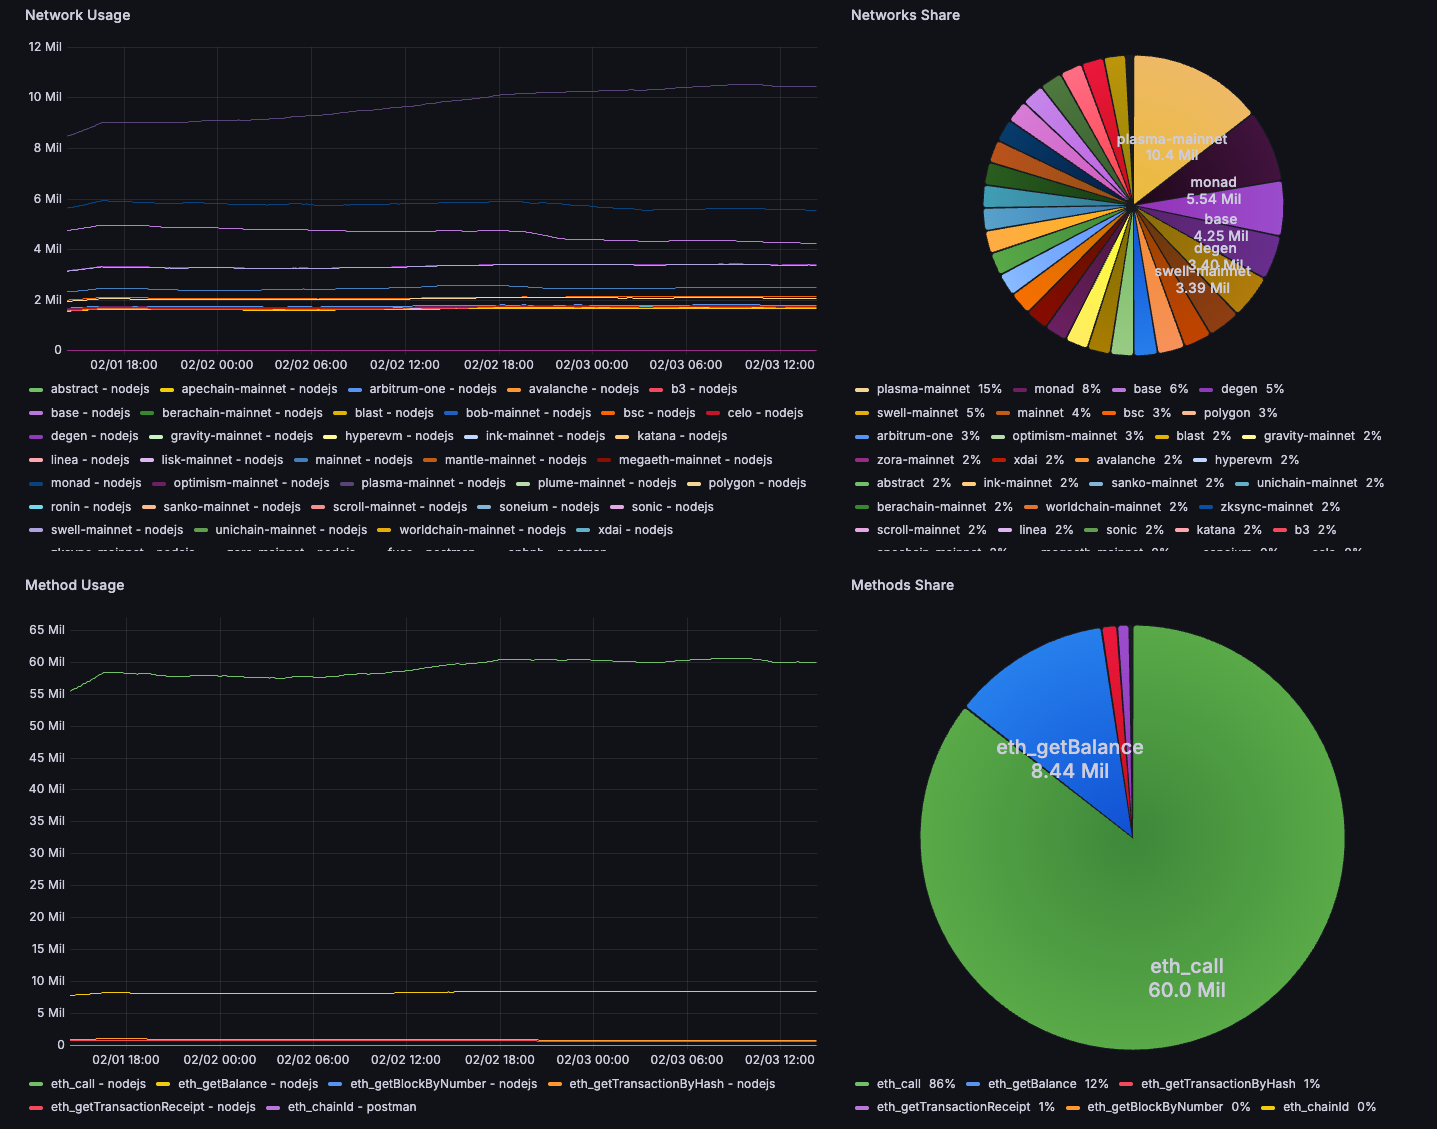
* **Network Usage** — Time-series chart showing request volume broken down by blockchain network
* **Networks Share** — Pie chart displaying the distribution of traffic across different chains (e.g., plasma-mainnet, monad, base, swell-mainnet)
* **Method Usage** — Time-series showing which RPC methods are being called over time
* **Methods Share** — Pie chart breakdown of method distribution (e.g., `eth_call`, `eth_getBalance`, `eth_getTransactionByHash`)
### Usage
* **Network Usage** — Time-series chart showing request volume broken down by blockchain network
* **Networks Share** — Pie chart displaying the distribution of traffic across different chains (e.g., plasma-mainnet, monad, base, swell-mainnet)
* **Method Usage** — Time-series showing which RPC methods are being called over time
* **Methods Share** — Pie chart breakdown of method distribution (e.g., `eth_call`, `eth_getBalance`, `eth_getTransactionByHash`)
 ### Networks
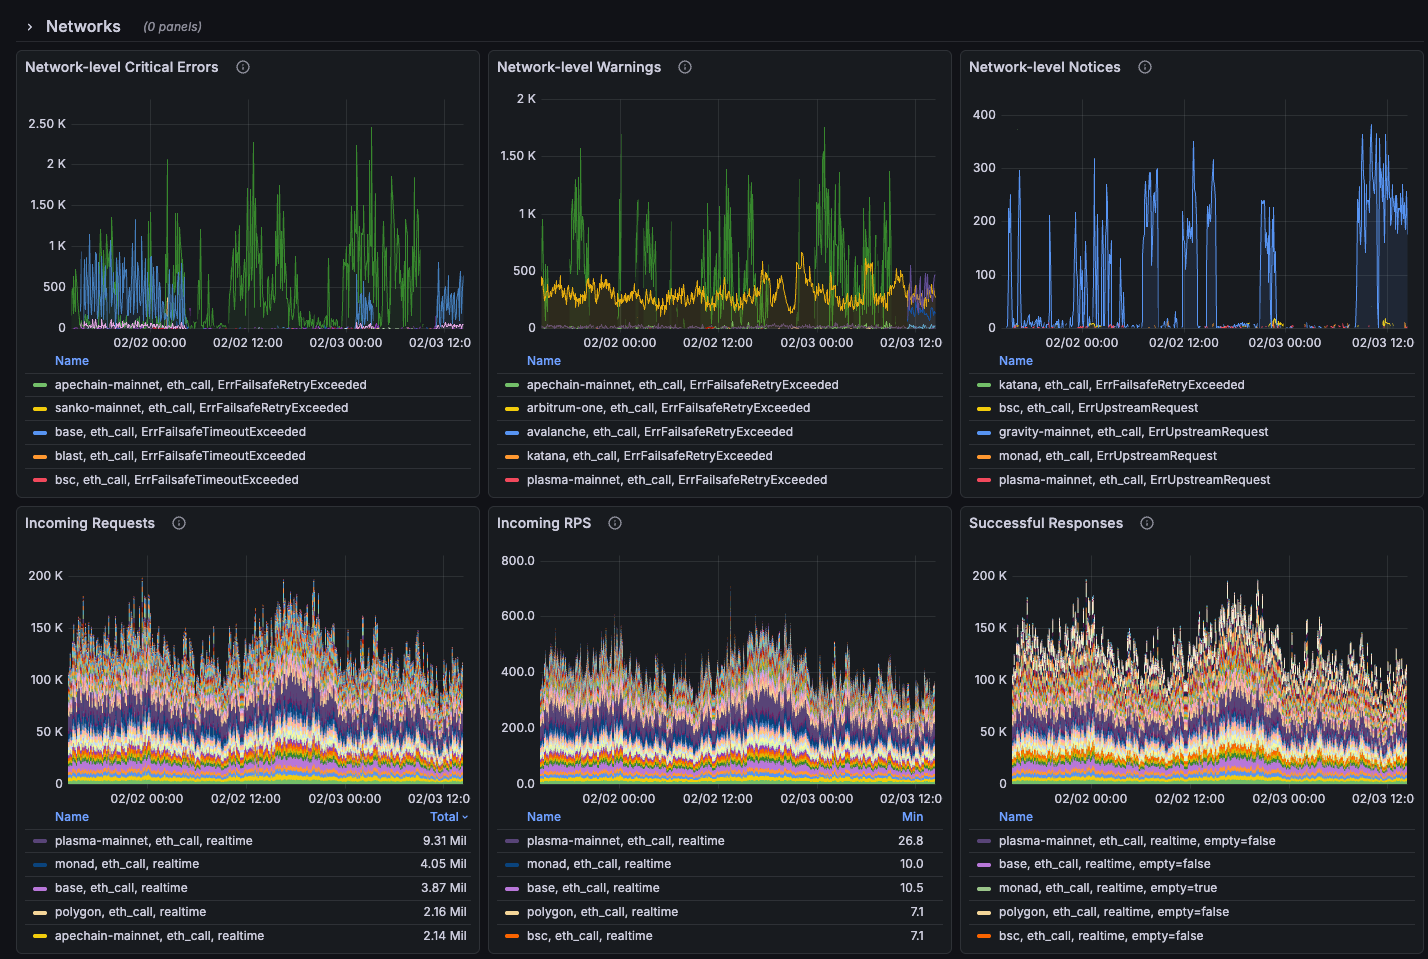
* **Network-level Critical Errors** — Track critical failures by network and error type
* **Network-level Warnings** — Monitor warnings like missing data from endpoints
* **Network-level Notices** — Informational events such as upstream request issues
* **Incoming Requests** — Request volume per network over time
* **Incoming RPS** — Requests per second breakdown by network
* **Successful Responses** — Success rates with empty vs non-empty response tracking
### Networks
* **Network-level Critical Errors** — Track critical failures by network and error type
* **Network-level Warnings** — Monitor warnings like missing data from endpoints
* **Network-level Notices** — Informational events such as upstream request issues
* **Incoming Requests** — Request volume per network over time
* **Incoming RPS** — Requests per second breakdown by network
* **Successful Responses** — Success rates with empty vs non-empty response tracking
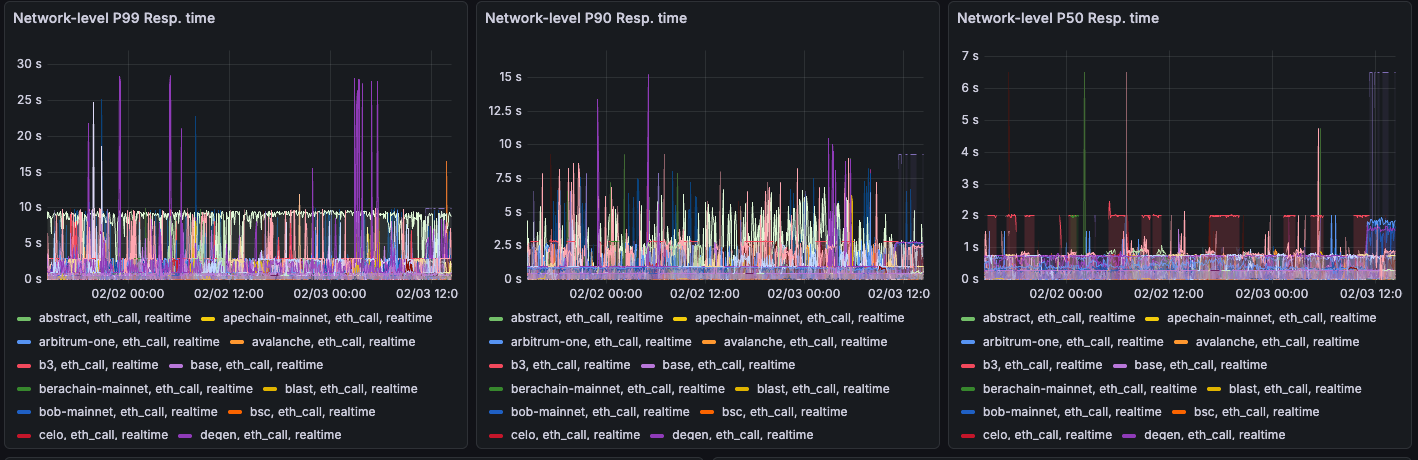
 * **Network-level P99/P90/P50 Resp. time** — Response time percentiles by network for performance analysis
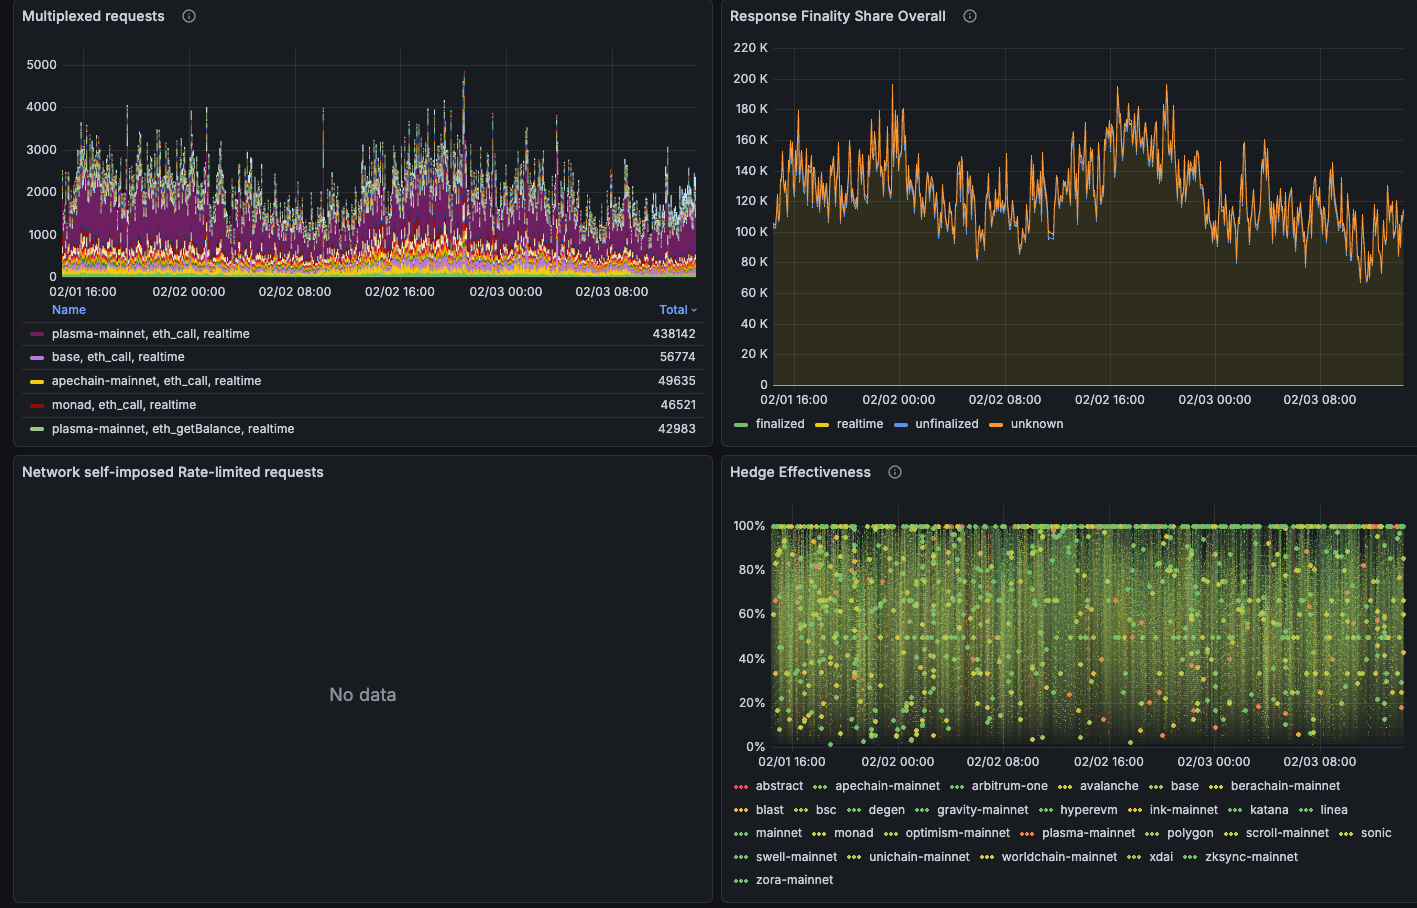
 * **Multiplexed requests** — Requests that were deduplicated across multiple callers
* **Response Finality Share** — Distribution of finalized vs real-time responses
* **Rate-limited requests** — Self-imposed rate limiting events
* **Hedge Effectiveness** — Performance of hedging mechanisms across providers
* **Multiplexed requests** — Requests that were deduplicated across multiple callers
* **Response Finality Share** — Distribution of finalized vs real-time responses
* **Rate-limited requests** — Self-imposed rate limiting events
* **Hedge Effectiveness** — Performance of hedging mechanisms across providers
 ## Logs
Edge RPC provides detailed error logging with full context on failed requests, including error type, network, method, and upstream provider information for fast debugging.
## Logs
Edge RPC provides detailed error logging with full context on failed requests, including error type, network, method, and upstream provider information for fast debugging.