Overview
The Turbo Pipeline Health Overview dashboard is a Grafana-based view that aggregates the most important signals across all of your Turbo pipelines in a single place. Use it to quickly spot pipelines that are falling behind, catch checkpoint failures, and isolate whether latency is coming from the source, the pipeline, or a specific sink. To open it:- Sign in to the Goldsky dashboard and go to the Pipelines page.
- Click Health overview in the top-right corner of the Pipelines page. This opens your project’s Grafana workspace in a new tab, pre-authenticated to your project, with the Turbo Pipeline Health Overview dashboard loaded.
Health overview (on the Pipelines page) and Advanced metrics (on an individual pipeline) open different dashboards. Advanced metrics opens the legacy per-pipeline metrics view scoped to that one pipeline. To get the project-wide health overview described on this page, use Health overview from the Pipelines page.
Where to look first
When something looks off, work through these checks in order — each one rules out a class of problem before you dig deeper.1
Is Checkpoint Failures non-zero?
Open pipeline logs immediately. A failed checkpoint means the pipeline is not durably saving its position. See Summary.
2
Is Block Lag growing?
Check Sink Flush Latency next — growing block lag is usually a downstream sink causing backpressure, not a slow source. See Block lag.
3
Are sinks fast but Checkpoint Duration high?
Tune batch settings. Raise
batch_size or lower batch interval. See Checkpoint duration P95.4
Is sink flush latency elevated on one pipeline?
Click that pipeline in Pipeline Status to open its detailed dashboard and break flush latency down by sink. See Sink flush latency P95.
Summary
The Summary row at the top gives you a health check across every active pipeline in the project.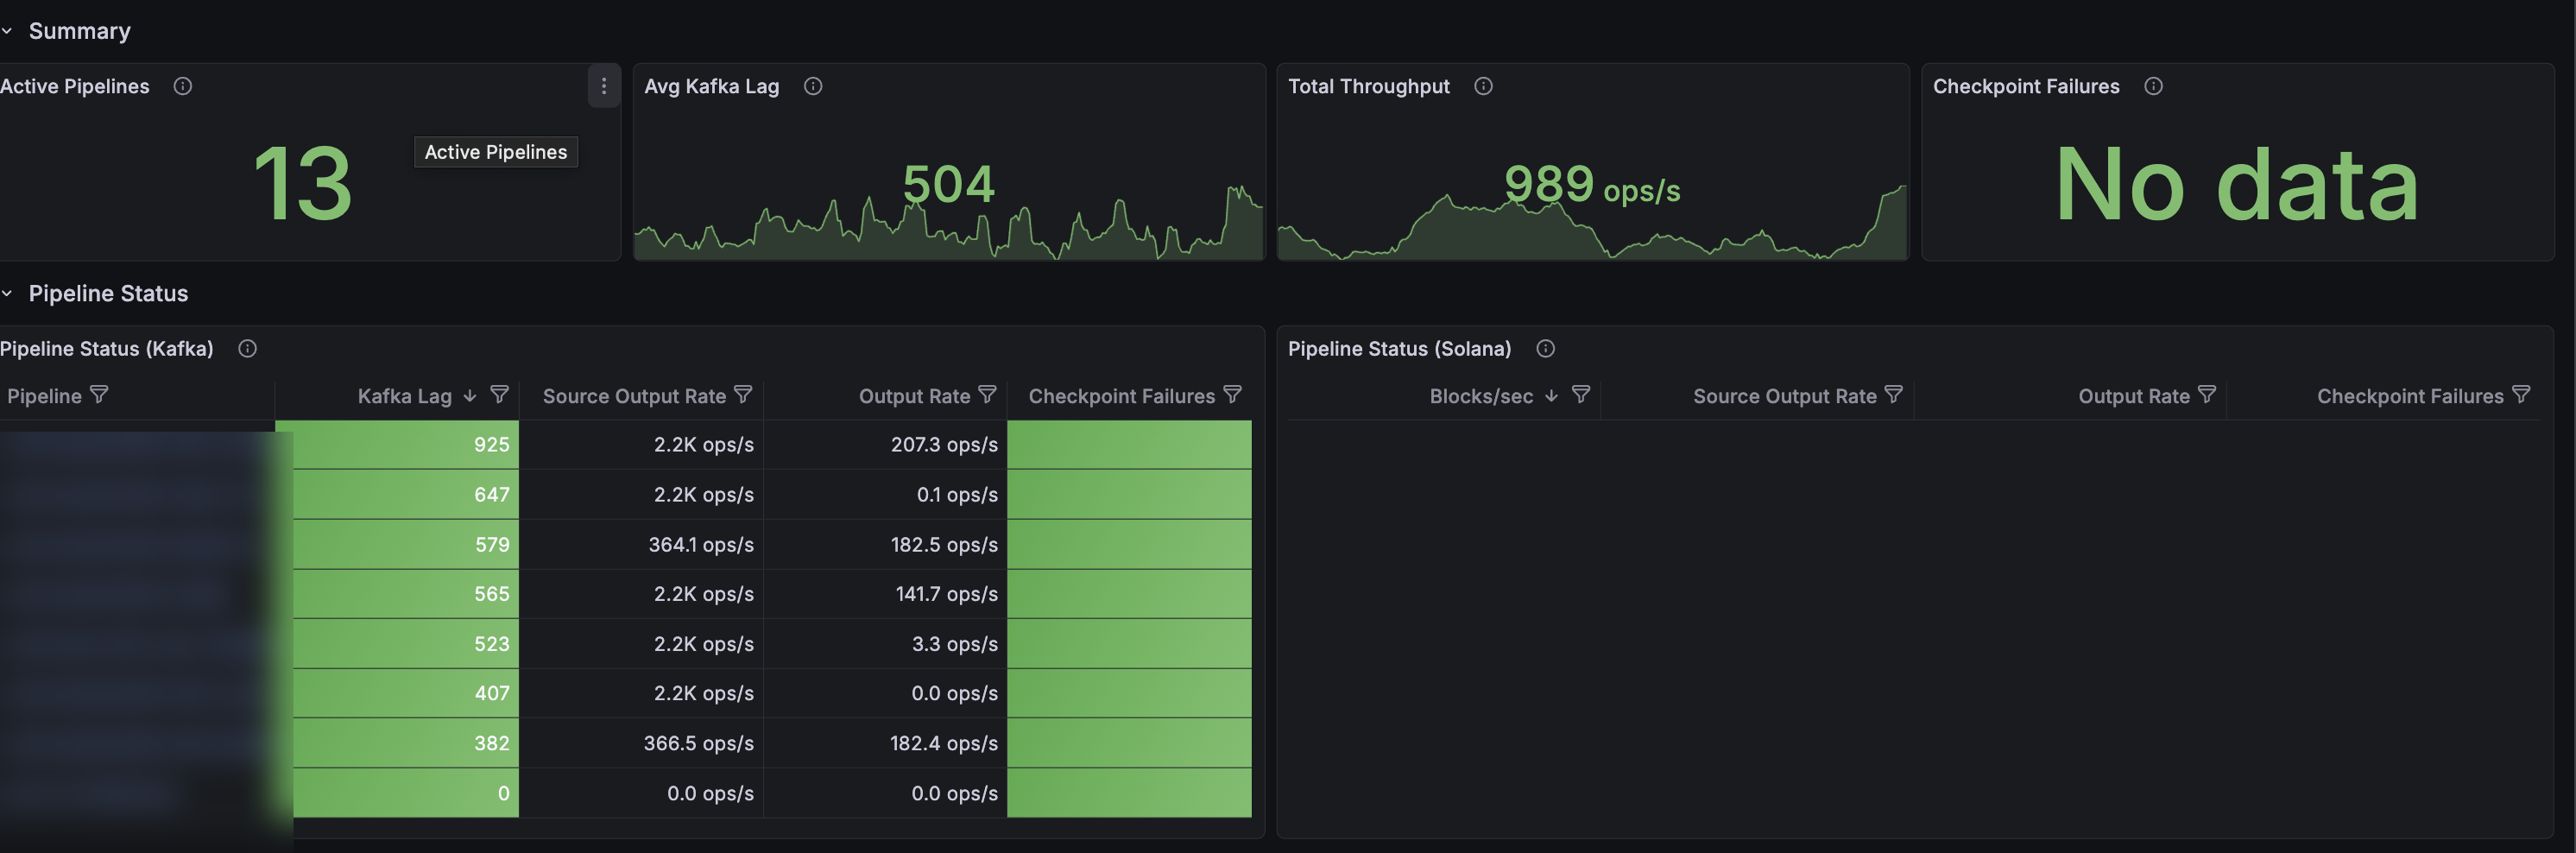
- Active Pipelines — number of pipelines currently emitting metrics.
- Avg Kafka Lag — the max Kafka consumer lag per pipeline, averaged across all pipelines, in messages. Kafka lag is a good proxy for sink lag — if your sinks (e.g. Postgres, ClickHouse) start falling behind, Kafka lag will grow.
- Total Throughput — combined rate of records being written to all sinks, in records per second.
- Checkpoint Failures — total number of checkpoint epoch failures across all pipelines in the selected time range. Should almost always be No data or zero.
Pipeline status
Below the summary, Pipeline Status breaks the same signals down per pipeline — Kafka-based EVM pipelines on the left (Pipeline Status (Kafka)), Solana pipelines on the right (Pipeline Status (Solana)). Each row shows current Kafka lag (EVM) or blocks/sec (Solana), source output rate, sink output rate, and checkpoint failures in the last 10 minutes. Click a pipeline name to jump to its detailed dashboard.High Kafka lag on its own does not mean a pipeline is falling behind — a pipeline that is intentionally processing a lot of historical data will show high lag while catching up. Watch for spikes or steadily increasing lag on a pipeline that was previously steady. That usually means the pipeline needs tuning: larger batch sizes, longer batch intervals, or increased sink parallelism.
Block lag
Block lag tells you how far behind the chain tip the most recent block the pipeline has processed is, in seconds.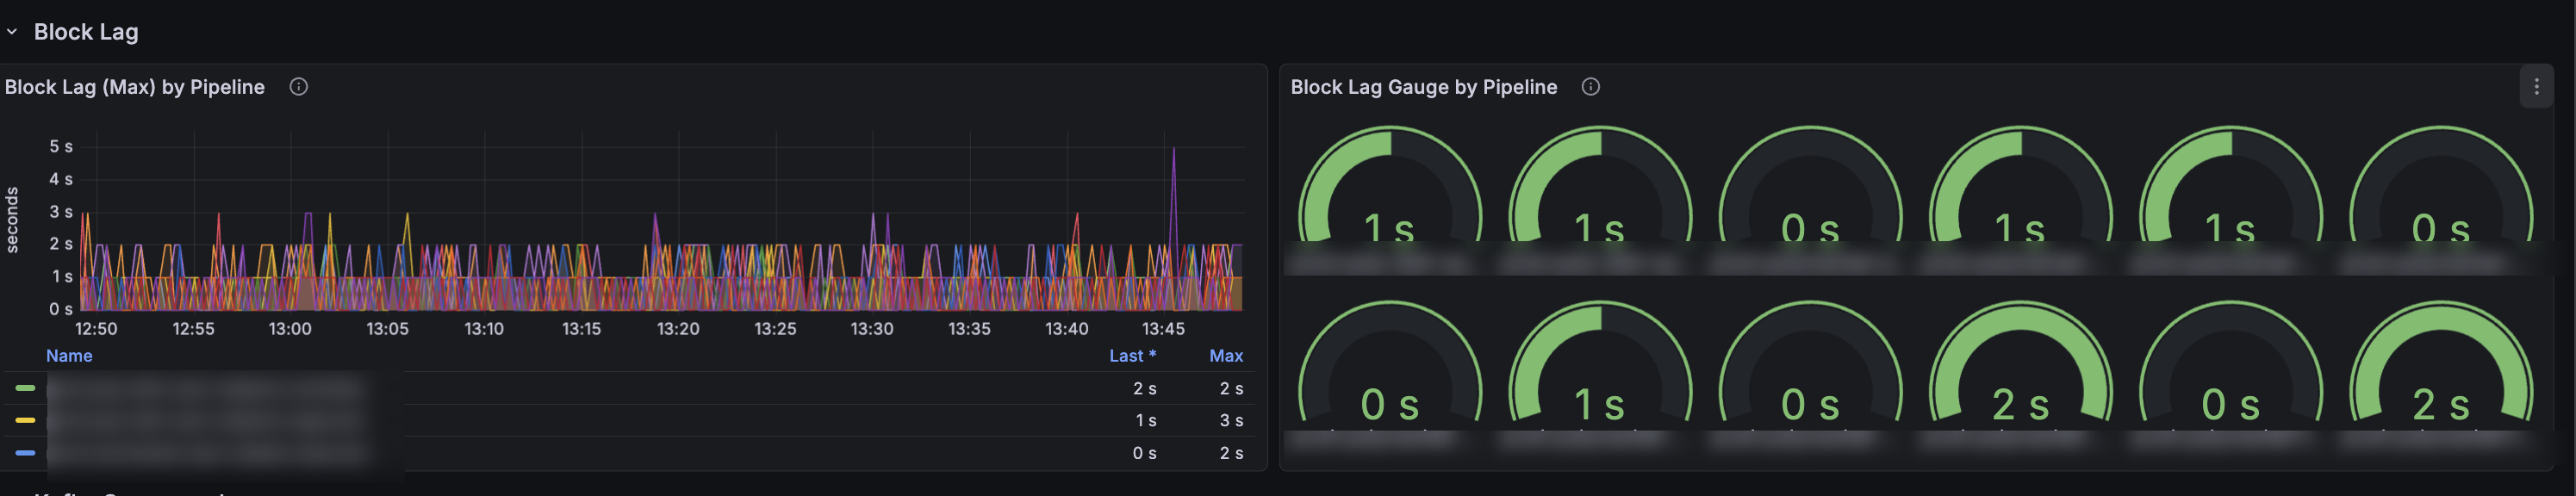
- Block Lag (Max) by Pipeline plots block lag over the selected time window, in seconds.
- Block Lag Gauge by Pipeline shows the current block lag for each pipeline as an at-a-glance gauge.
Block lag is measured using the reported block time for each chain. Some chains only propagate block headers to indexers a few seconds after the block is produced, so a steady baseline of a few seconds of lag on those chains is normal.
Performance
The performance panels help you isolate where latency is coming from when you need to tune a pipeline.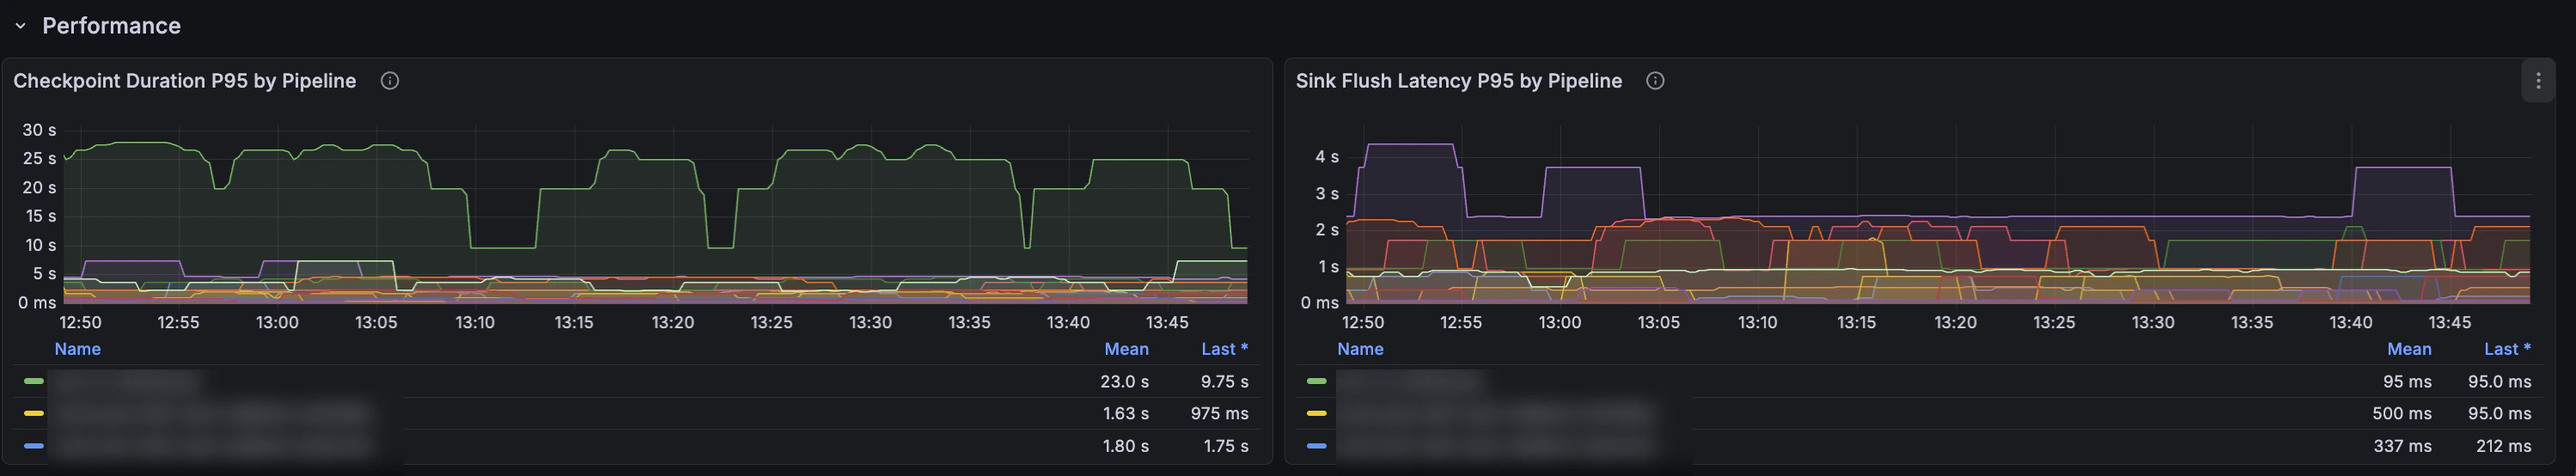
Checkpoint duration P95
Checkpoint duration is a signal for how long data stays inside the pipeline before it is confirmed as delivered. A checkpoint is only confirmed (flushed) when every record in the batch has been fully sent to every sink. Long checkpoint durations usually mean one of two things:- Your batch flush interval is high, so records are collected for longer before being sent.
- One or more sinks are slow, so batches take longer to drain.
Sink flush latency P95
Sink flush latency measures how long the pipeline’s sinks take to accept a batch when the pipeline flushes to them. The Sink Flush Latency P95 by Pipeline panel on this dashboard rolls the per-sink values up to one line per pipeline — use it to spot which pipeline is the bottleneck. To break a specific pipeline’s latency down by individual sink, open its detailed dashboard by clicking the pipeline name in Pipeline Status. Typical causes of high sink flush latency:- Database is undersized for the write volume.
- Missing indexes on the target table causing slow upserts.
- Network latency between the sink and the pipeline.
- Sink-side back-pressure (e.g. Kafka broker slow to ack).
Kafka consumer lag
The Kafka Consumer Lag row breaks Kafka lag out per pipeline — a time-series panel (Kafka Lag by Pipeline) and a current-value gauge (Kafka Lag Gauge by Pipeline). Reach for the time-series panel when you need to answer “when did this pipeline’s lag start climbing, and did any others climb with it?” — it makes it easy to correlate a lag spike with a deploy, a chain reorg, or a downstream slowdown.Throughput
The Throughput row shows two panels: Input Records Rate by Pipeline (records/sec received from sources) and Output Records Rate by Pipeline (records/sec written to sinks), both stacked per pipeline. Use them to see the total read and write volume for the project and identify which pipelines dominate it — useful for capacity planning and spotting runaway load.Checkpoints
The Checkpoints row shows Checkpoint Success Rate by Pipeline and Checkpoint Failure Rate by Pipeline as time series. The failure-rate panel is the time-series companion to the Summary’s single Checkpoint Failures number — pair it with an alert on checkpoint failures so you catch them in real time instead of on a dashboard check.Solana source
The Solana Source row is specific to Solana pipelines and exposes source-internal signals that don’t apply to EVM chains:- Solana Blocks/sec — how fast the pipeline is pulling Solana blocks from its source.
- Solana Buffer Size — internal buffer depth. Rising buffer length means the downstream pipeline can’t consume as fast as the source is producing.
- Solana Fetch Duration P95 — how long individual source fetches are taking.
Next steps
- Set up custom alerts on these metrics to get notified in Slack or email before lag becomes a problem.
- Pipe the same metrics into your own observability stack with the Prometheus integration.
- Drill into a specific pipeline with Live Inspect to see the actual records flowing through.
- Tune pipeline throughput via
resource_size, batch settings, and sink parallelism — see the pipeline configuration reference.